Statistics and the connected classroom

Every primary classroom studies statistics several times a year and when it comes to graphs you go through the process:  surveys, tally charts, pictograms, bar graphs,
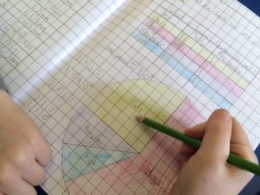
This Pie Chart was a truly enjoyable lesson, as the students used protractors and their knowledge of degrees to draw the graph.

column graphs, line graphs, stem & blah, blah…

I am one of those who gets their students to make pretty graphs based on a a survey (favourite pet or book or blah..) and I have known for years that it is just going through the motions. The students learn skills (using a ruler, counting hands up in the classroom and colouring in a chart), but do they make any understandings? Maybe you integrate ICT and have a play with Excel, but do they make any connection to the real world or see statistics outside their classroom?


NOTE: Every class I have ever taught has loved making graphs – ruling them, colouring them and presenting them with a couple of comments on what they think the graph is telling them – and I love the lesson as well.  I am just being a bit of a devils advocate with the previous paragraphs, not slandering every amazing teacher who gets their class to make a graph.


So, how do we take a classes questions and ask them to the world? How to we make a survey or questionnaire that has a sample size more than the number of students in your class? The answer is a Google form with some assistance from Twitter, Facebook, Email and a few forceful requests for friends to share the form and off you go.

We created the form from a whole lot of ‘random questions’ (this is how they have been described by many of those who have answered the form) and when the students went to get on the bus at the end of the day I began the sharing process. It did take begging in some cases, but only a few times and by the morning we had almost 200 responses and by our Numeracy lesson we had 250 responses.

The first 30-40 minutes of the Numeracy lesson began an animated discussion full of predictions on what we thought each questions results would be and then pondering why we were so wrong on almost every question. Additionally, as we reviewed the results 10 more people somewhere in the world answered the survey.


They said things like…

Why are the amount of Arabic speakers the same as the amount of Maori Speakers?
-I think Facebook might be banned in a lot of Arabic speaking countries.
-There are Maori speakers because Mr Dyer is from New Zealand.
-I just think that not many people who speak Arabic have seen the survey…
…and maybe if they did the could not read it because it was in English?

Why do over 60% the people answering our survey wear glasses or contacts when less than 10% of our class do?

Why are most of the people who answered Women? Is it because they use more social media or because they take more time to help people?

Why do only a few people like Orange… it’s my favourite colour?

66% of people take a car to work or school – that is two out of three people… That is bad for the environment.

Wow, a lot of people believe in Aliens!


Unknown
Yellow indicates the spread of our survey within the first 24 hours. I wonder how much yellow there will be after a week?

We then looked at different types of questions and discussed how we normally write closed questions, but by giving an open question like “What is your favourite food?” we get to see how truly different everyones choices are, but when we asked closed questions with a yes or no answer or only a few options it does not always give the person taking the survey the option of answering as they would like.

At the end of the first 24 hours my tech savvy and like minded teaching assistant took the data and turned it into a visual world map. Places in yellow are where we have reached already.

So now, after 3 days of the form being online we have reached just over 500 participants and we see the statistics beginning to even out to what we originally predicted. Hopefully over the weekend we will get more participants and as it spreads we may reach across to more parts of Africa or South America. So, next time you are studying statistics and want your class to get a better understanding of analyzing data give a Google Form a try and use all those social media contacts you have to see how far  you can spread your questions.

PLN and Connectivness is Awesome! #EduFriends

Again, Twitter and my PLN has blown me away with its awesomness!

As ICT Lead Teacher I had to lead an assembly and chose the Internet as my umbrella topic. My goal was to express both the ability to connect through the internet as well as make sure that students were aware of how to use the Internet safely and sensibly.

Part 1 – Teacher Quiz
10 simple questions. Two teachers. One teacher has a stack of reference books where all the questions came from. Other teacher has no books, looks sad so is allowed to use Google on their phone.
Result – A few good laughs and students get to see the power of a directed internet search in action.

Part 2 – The connection (This is what it is all about!)
How do you show kids about the true connectiveness of the internet? Sure they have all Skyped a family member overseas, but how could I show them in 1 or 2 minutes?

Screen Shot 2015-10-16 at 3.48.05 pm

A simple tweet, and maybe a few directed spam tweets, and the ball was set in motion. I was humbled by the replies and the time and effort that was put into the project. Instantly there were promises of a video or a quick video taken in the playground. I had replies from people I was not even following and so new connections were made.

Screen Shot 2015-10-16 at 4.32.24 pm

Below is the compilation video. I am sorry that not all clips are included, but my computer was fighting with me and not all of the clips wanted to go into iMovie for some reason. But thank you to @NZWaikato @mrs_hyde @mrkempnz @KleinErin @BowlerSarah @jedipadmaster @SamAllison06 @21stCTeaching @MsBeenz @PalmyTeacher @room_ten @tewakatroy @chiaoyinanita @ChezVivian @tsbray @lesal38 @mjbuckland and of course the star of the show… @GrogtheZombie.
(If I have missed you off this list then I am sorry – DM me and I will correct instantly as you are awesome and I am sorry for missing you out, but thankful for your existence!)

Part 3 – Cyber Safety
As most of the students play online games with back channel chat options I chose to show the video I have embedded below. I must say that I removed about 6 seconds of the clip towards the end as I think that I would have had the year 1 classes in tears.
Result – Enjoyable to watch, appropriate to the audience, students become more aware of cyber safety.

KS2 Robotics Club – Surprisingly Successful

It is funny what a bit of success, a few years practice and some more resources can do to the way an after school club is run. I have talked about this previously, but this year is different as my robotics group is much younger (KS3 – Year 3,4&5 or Grade 2,3&4). The groups is right on the cusp of being too big for one teacher at 16 students, but I think that I have carefully managed and planned the sessions so that it will run a lot smoother than when I had teenagers last term.

The big difference is that I have carefully purchased resources from my budgets to build upon what we have and to provide different levels of differentiation and challenge for each student.
Very Beginner – Bee Bots
These are a great resource to introduce programming, quite cheap and can still be used with older kids to get the idea of simple programs.
Novice – Lego Simple Machines Kits So simple, but the best way to show kids how gears work together to make movement happen and gets them following a set of what can be difficult instructions.
Intermediate – WeDoBuild it and then program it. It comes with a motor, movement/light sensor and a tilf sensor and simple Scratch like software to program your creation.
Advanced – Mindstorms You only need to look at various youtube videos to see what can be done with a Mindstorms kit and if you throw a few kits together you have amazing possibilities.

Next problem comes when every group has a project completed and wants a computer to use to program the robot… solution? I have no idea just yet!

Student Created Tutorials in Numeracy

Holiday is over and back in class and this is my first post of the school year. I think it is a nice cross of Numeracy and ICT skills.

Each group has been working on mastering a different strategy in Maths and then developing the ability to explain what they are doing verbally. What is an easy way for the teacher to assess and for the students to show mastery… in pairs create a Kahn Academy style tutorial.

One student records the other working through a problem (this reduces the camera shakiness) then they swap over so each has a problem recorded. Import the clip to iMovie, turn off the videos sound to remove the white noise from the classroom then find a quiet space and record a voice over and publish the movie. The first time that I did it they recorded audio as they worked through the problem, but this distracted them from the equation and made them a bit nervous, but by separating the explanation and the problem it allowed students to focus on the task.

The video below if from a student who is not too confident in Maths, and did record the voice over three times, but by the finished product he was able to clearly explain what he was doing, why he was doing it and had a huge smile on his face – success!

My only wish now is that I was not in China and my students had access to a blog to publish their work on.